Mold flow analysis is a core feature in our product development stage, as we try to eliminate 95% of manufacturing errors at the design stage to build the most economical and quality parts. Further down here explans the process and terms that are involved in this analysis.
We used a standard stool model for this illustration, which was designed for ABS material analysed on Solidworks Plastic Simulation.
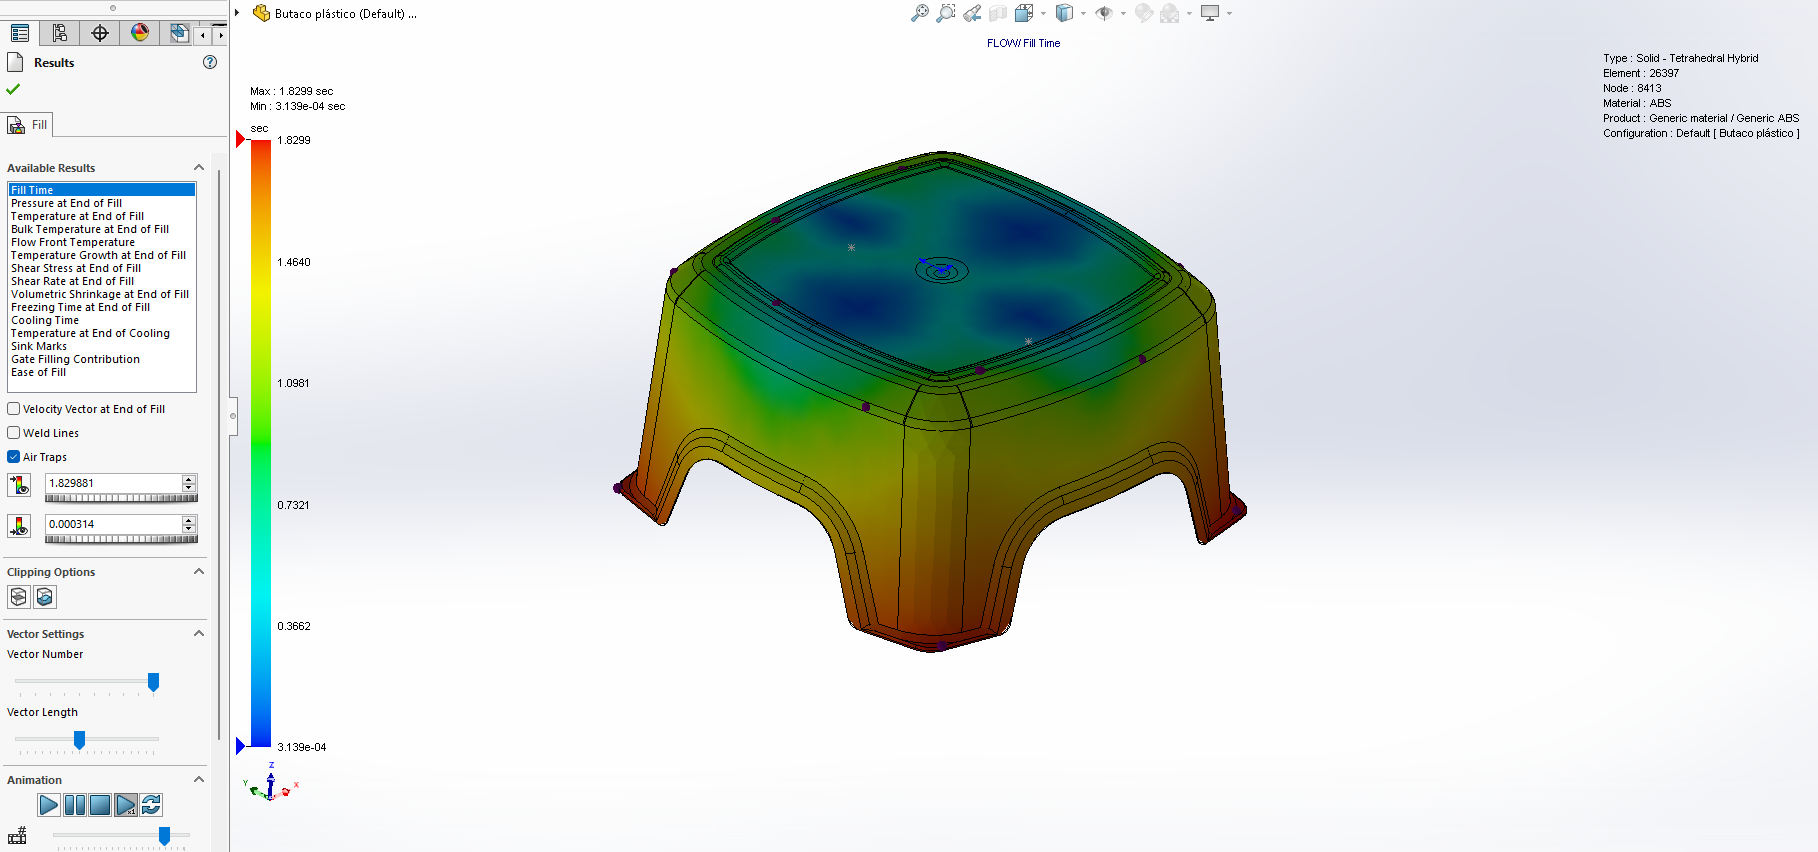
Fill Time

The fill time plot above displays the profile of the plastic melt as it flows through the mold part cavity during the filling stage of the injection molding process. The blue regions indicate the start or beginning of the flow front.
The red regions indicate either of the following:
- The flow front position at any given time interval during an animation of the filling stage
- The end of fill when the flow has stopped, even if the software detects a short shot
The filling pattern radiates out from the centre (blue) to the end of fill (red) located at each corner of the part. The colour scale situated to the left of the part indicates the time it takes for the flow front to reach a given cavity region. Since fill time is a function of flow length (among other things), the furthest corners away from the injection location are the last to fill.
Injection locations
The injection location is where the melted plastic enters a mold cavity. The last cavity area to fill is called the “end of fill”, typically located furthest from the injection location or in the thinnest wall sections. When a mold cavity cannot be filled by an injection location situated on either end of the part because the flow length is too long, you should move the injection location to a different location, resulting in shorter flow paths.
Moving the injection location to a central location will also minimize injection pressure requirements and result in a more uniform filling pattern from the injection location to the end of fill. Note that a change in injection location might result in a non-uniform filling of the cavity, where the melt reaches one end before the other. In this example, even though the melt has to travel in two directions, the flow length is cut in half, allowing the cavity to fill.
You can review the fill time plot to ensure that the extremities of the cavity are filled simultaneously. Use the results found from the initial change in injection location to find the optimum injection location. The injection location located at the middle of the handle’s left edge fills the lower section before the head of the drill casing. This uneven filling pattern will likely result in non-uniform packing and volumetric shrinkage and could cause post-moulding problems (such as warpage) in part.
You can review the fill time plot to ensure that the extremities of the cavity are filled simultaneously. Use the results found from the initial change in injection location to find the optimum injection location. The injection location located at the middle of the handle’s left edge fills the lower section before the head of the drill casing. This uneven filling pattern will likely result in non-uniform packing and volumetric shrinkage and could cause post-molding problems (such as warpage) in part.
Air Traps
In the molding process, when air is not vented out from the mold cavity during the filling stage, the trapped air can prevent the plastic material from filling the volume where the air traps are created, resulting in incomplete filling and packing. In some scenarios, the trapped air can get compressed, combust and cause burn marks on the molded part and/or damage the mold core and cavity surfaces. Placing a parting line vent, ejector pin, cavity insert, or a porous metal insert at these locations can help reduce or prevent air traps from occurring. Still, it is best to avoid them altogether.
Weld Lines
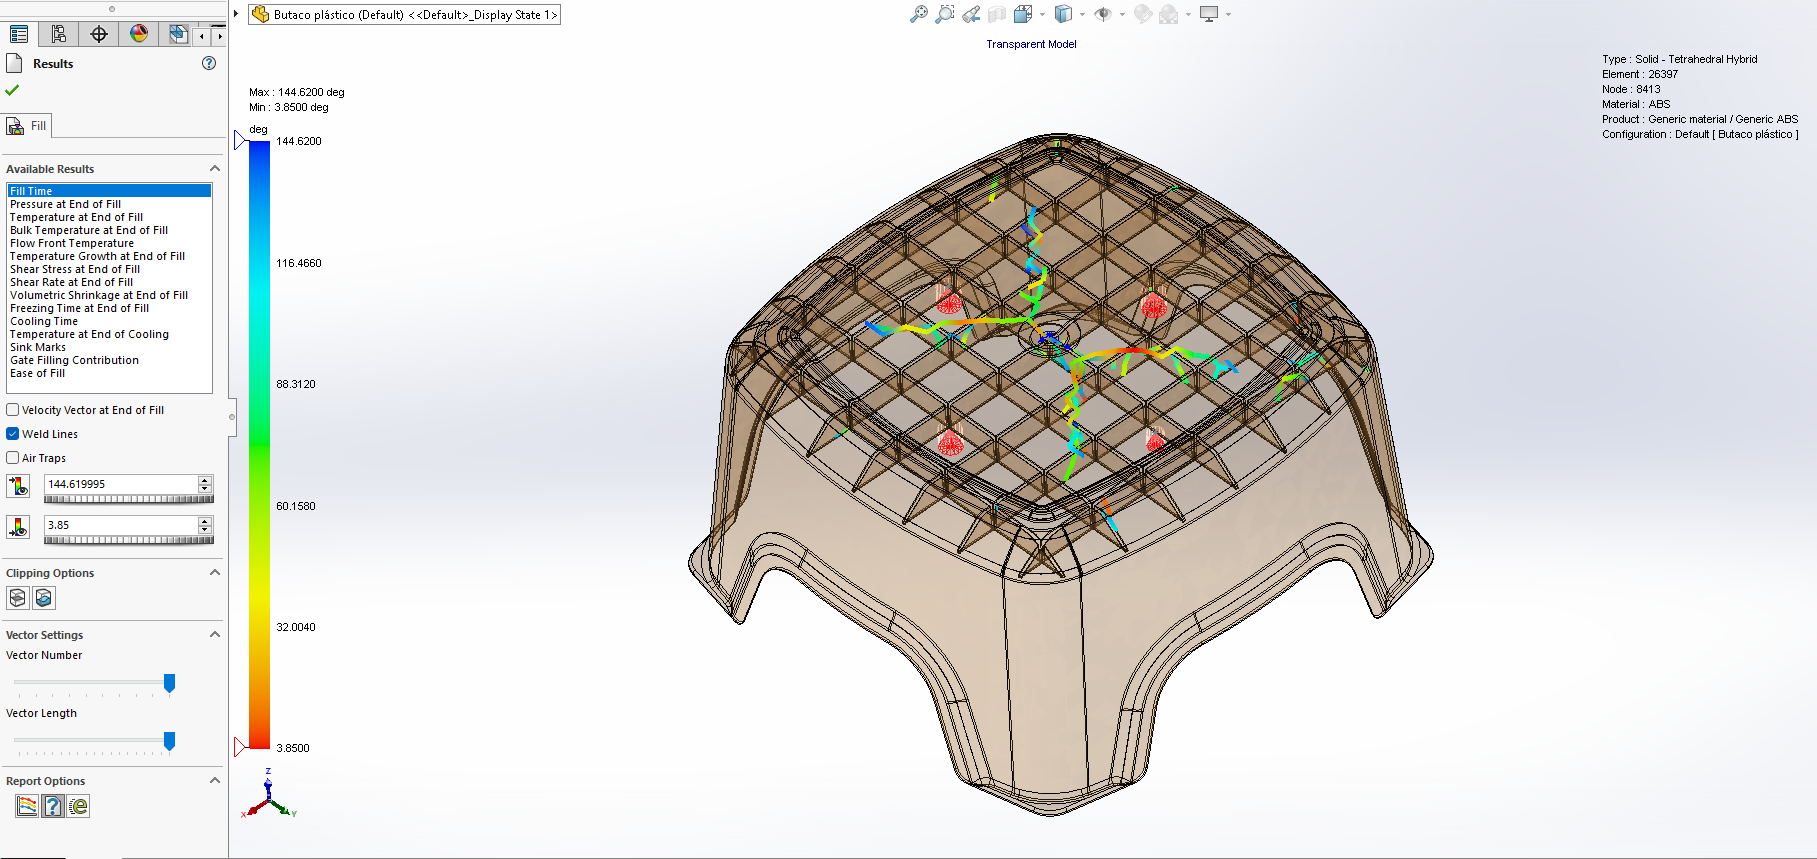
Weld lines are formed when two or more plastic melt fronts. They can be caused by mold shut-off surfaces, mold core features, multiple injection locations or wall thickness variations that cause flow front promotion or hesitation. Weld lines are typically weaker than areas without weld lines, and they often result in cosmetic defects. They can also act as stress concentrators in the molded part. Weld lines generally form 180degree opposite the point where the melt front makes contact with the standing core of a shut-off surface. Weld lines are unavoidable in parts with through-holes or multiple injection locations. So it needs to move the injection location to change the weld line; the weld line cannot be eliminated.
Velocity Vector at the end of Fill
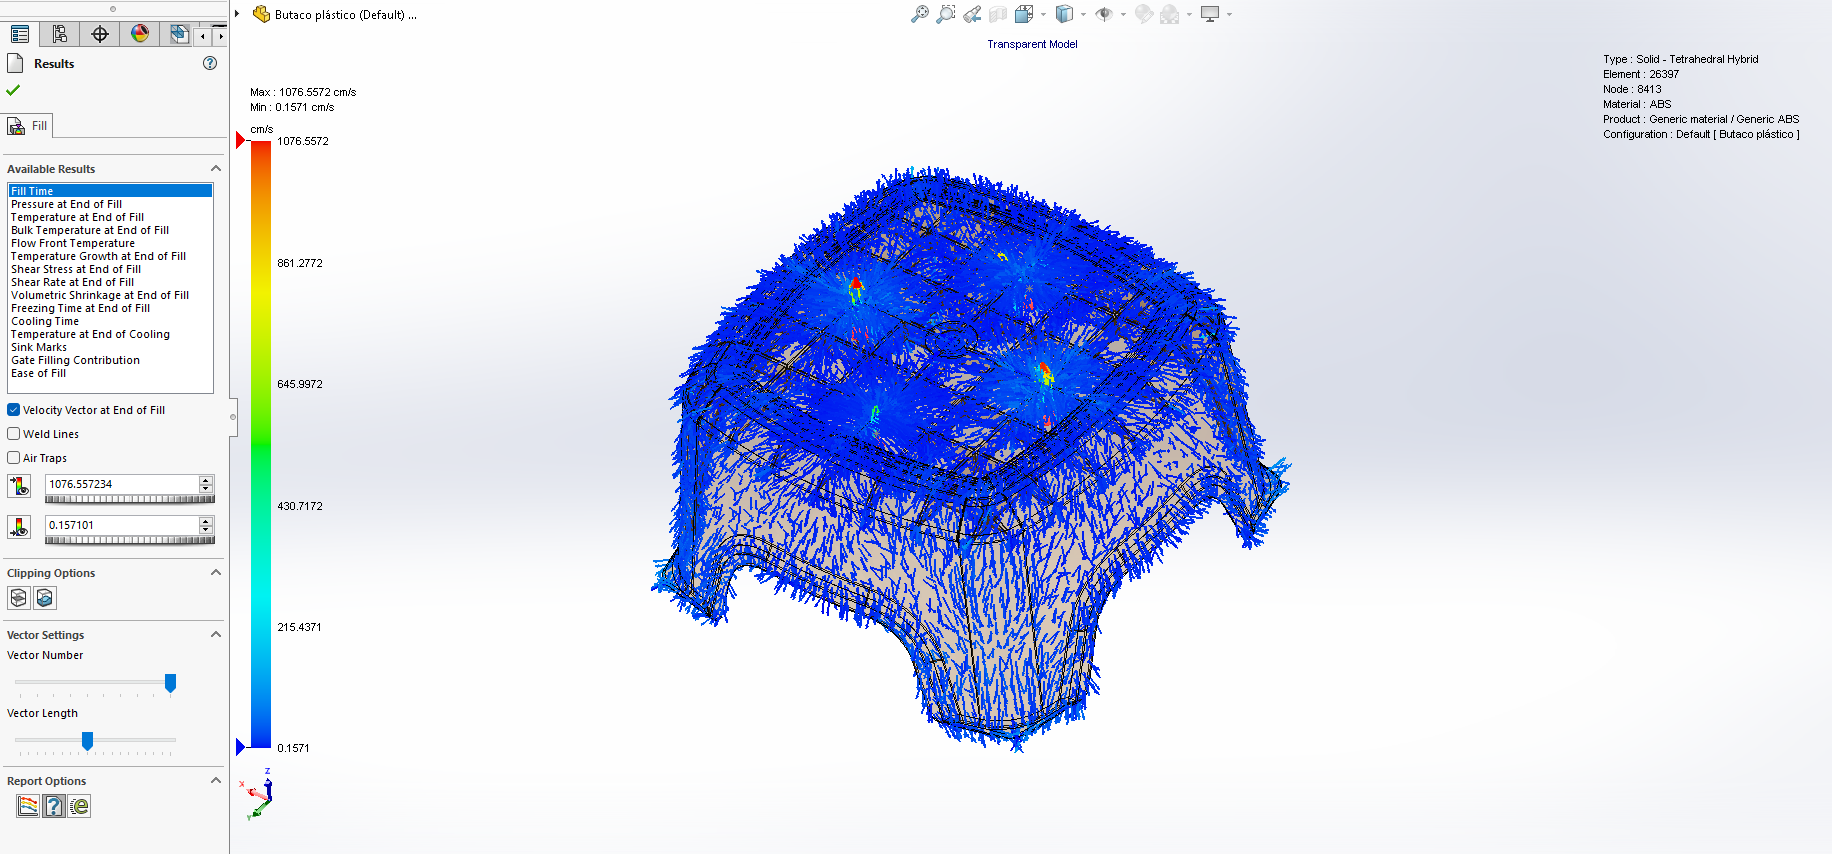
The velocity vector at the end of the fill plot indicates the molecular orientation that occurs as the melted plastic flows through the mold part cavity.
Spherical fillers result in a more uniform distribution of mechanical properties in both the direction of flow and transverse to flow direction. For fillers with high aspect ratios, mechanical properties in the flow direction differ from those transverse to the flow direction. A material with a high aspect ratio filler will typically have improved properties in the flow direction and lower mechanical properties transverse to the flow direction.
Pressure at the end of fill
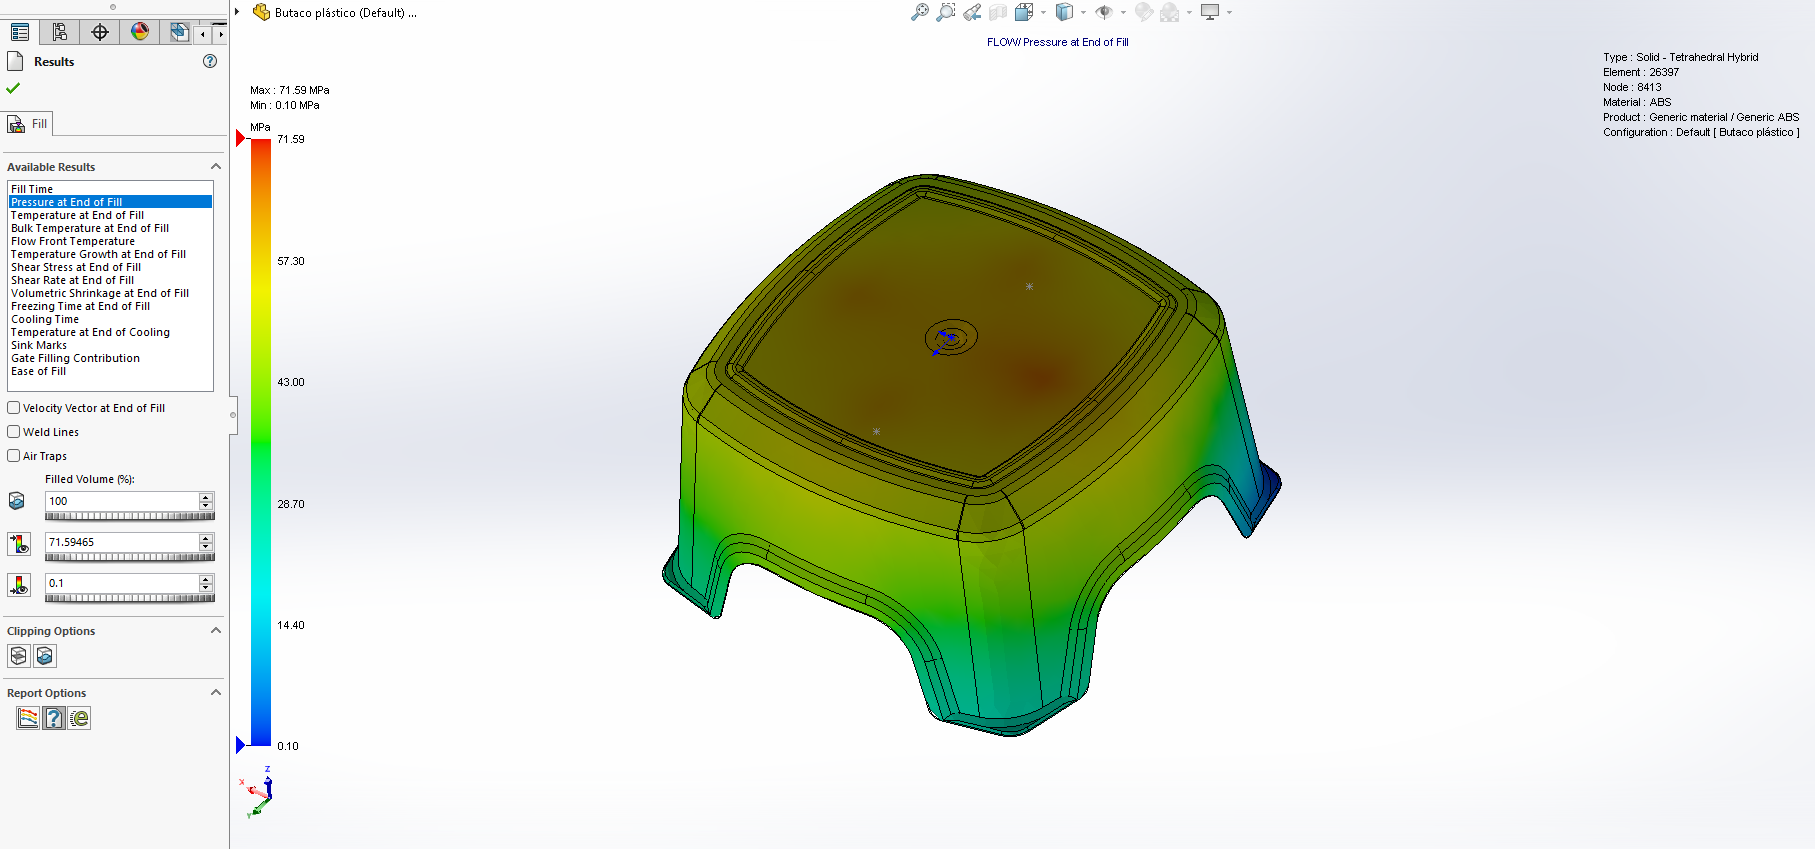
During the filling stage, the forward injection velocity of the reciprocating screw is controlled, which results in the pressure required to fill the cavity at that velocity. The injection pressure is propagated through the molten plastic and results in a pressure drop distributed along the flow length. The pressure at the end of the fill is an excellent indication of how evenly the cavity has filled.
Pressure drop is a function of flow length, part wall thickness, and melt viscosity. High pressures are required to fill thin-walled injection molded parts since the flow resistance through the smaller cross-sectional area is more outstanding. When the software detects a short shot, place the injection location near the middle of the part to reduce the flow length to about half the length of the part. If the injection location is near the end of a part, the flow length is essentially the entire length of the part. With the injection location located in the middle, flow lengths and injection pressure requirements are reduced even though the plastic flow must travel in two directions.
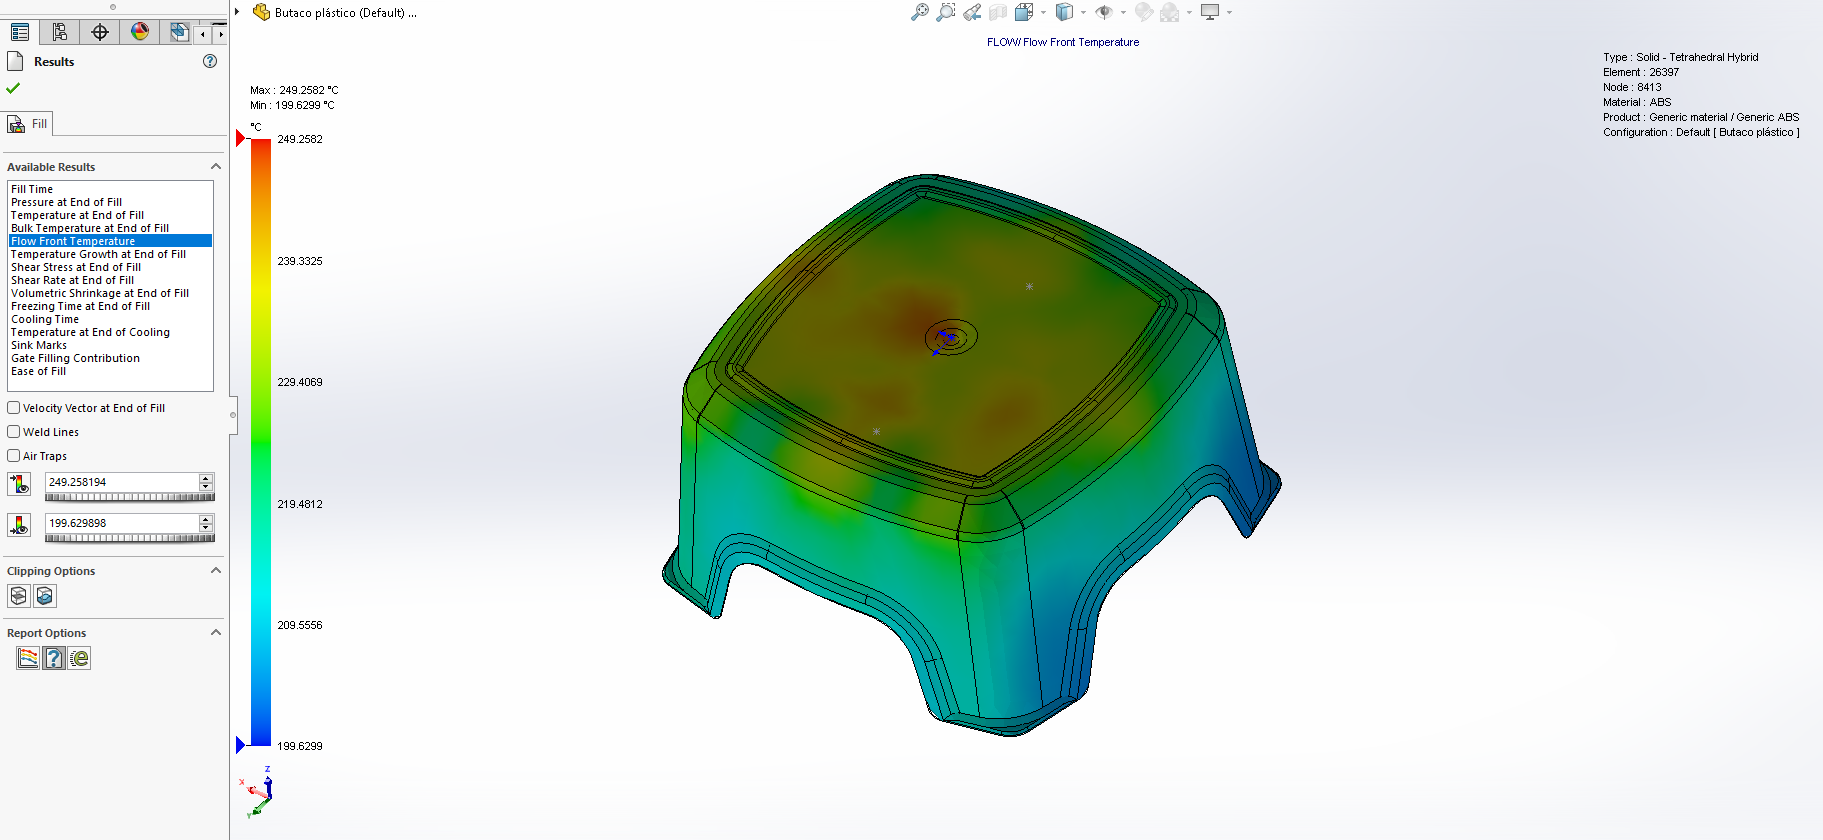
Temperature at End of Fill
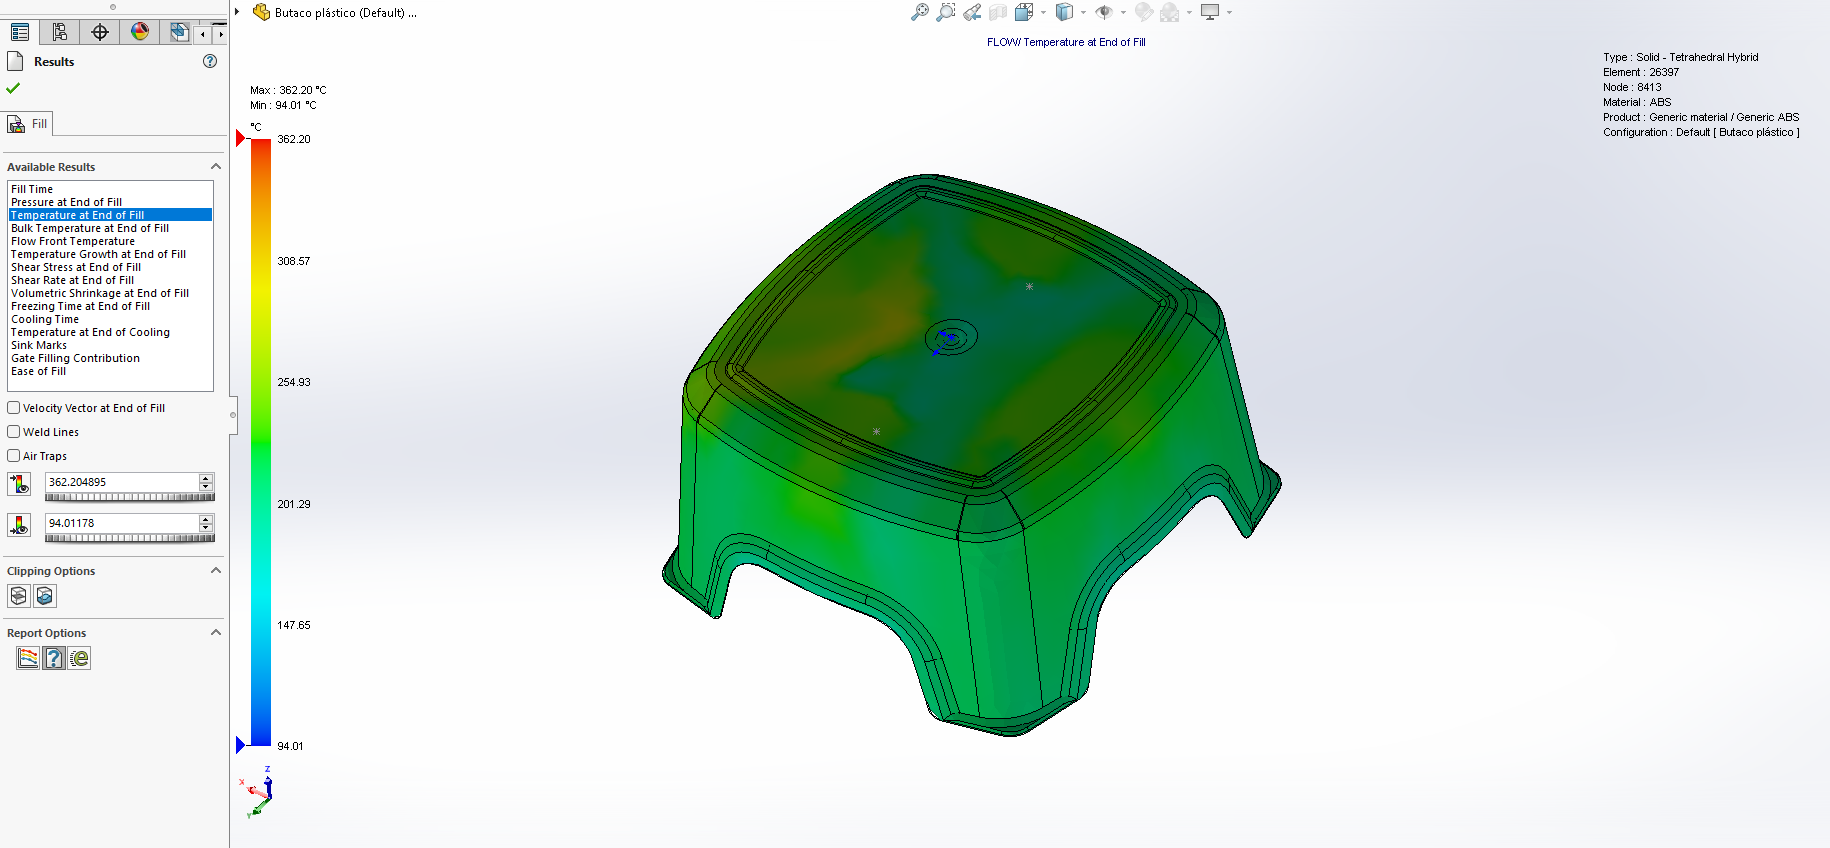
At the end of the fill, the plastic in contact with the cavity wall freezes into a very thin frozen layer that has cooled down to the temperature of the mold. The thickness of this frozen layer is independent of the thickness of the part wall. The thickness is dependent on the melt and mold temperature differential and the material thermal conductivity.
Bulk Temperature at the end of Fill
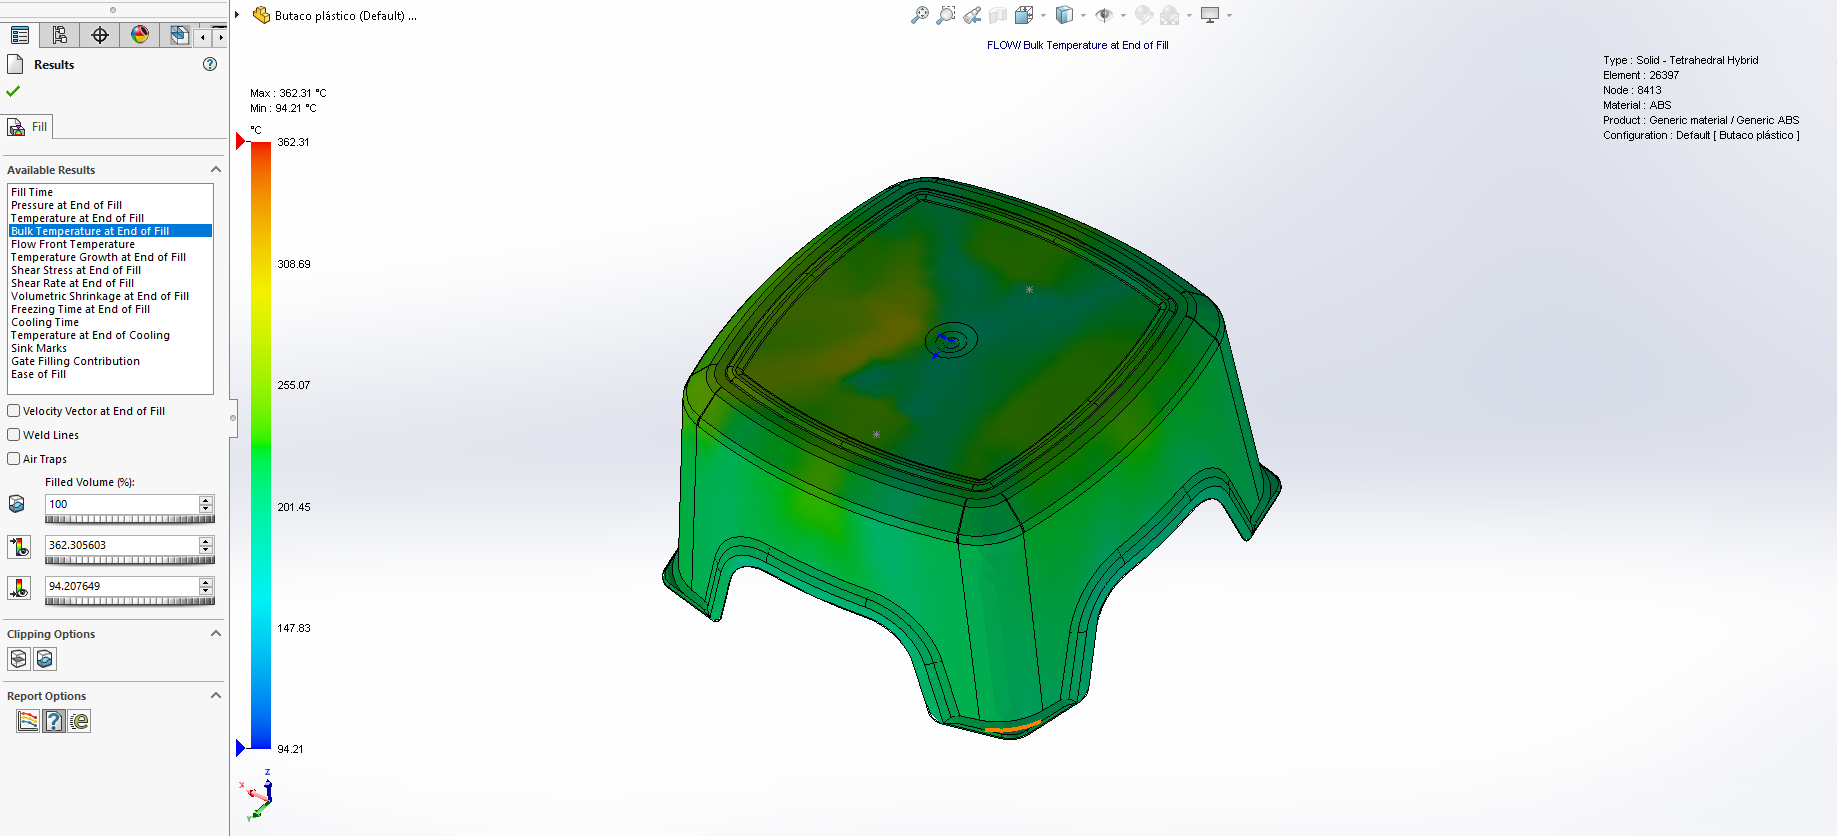
During the fill stage, changes in the melt temperature are calculated using parameters such as time, distance from the cavity wall, and part wall thickness. At the end of the fill plot, the bulk temperature displays how much the melt has changed from the set melt temperature. The Bulk Temperature plot indicates stagnant material, which has cooled significantly by the end of fill, in blue. The plastic material with a velocity just before filling, which retains heat, is red.
Temperature Growth at End of Fill
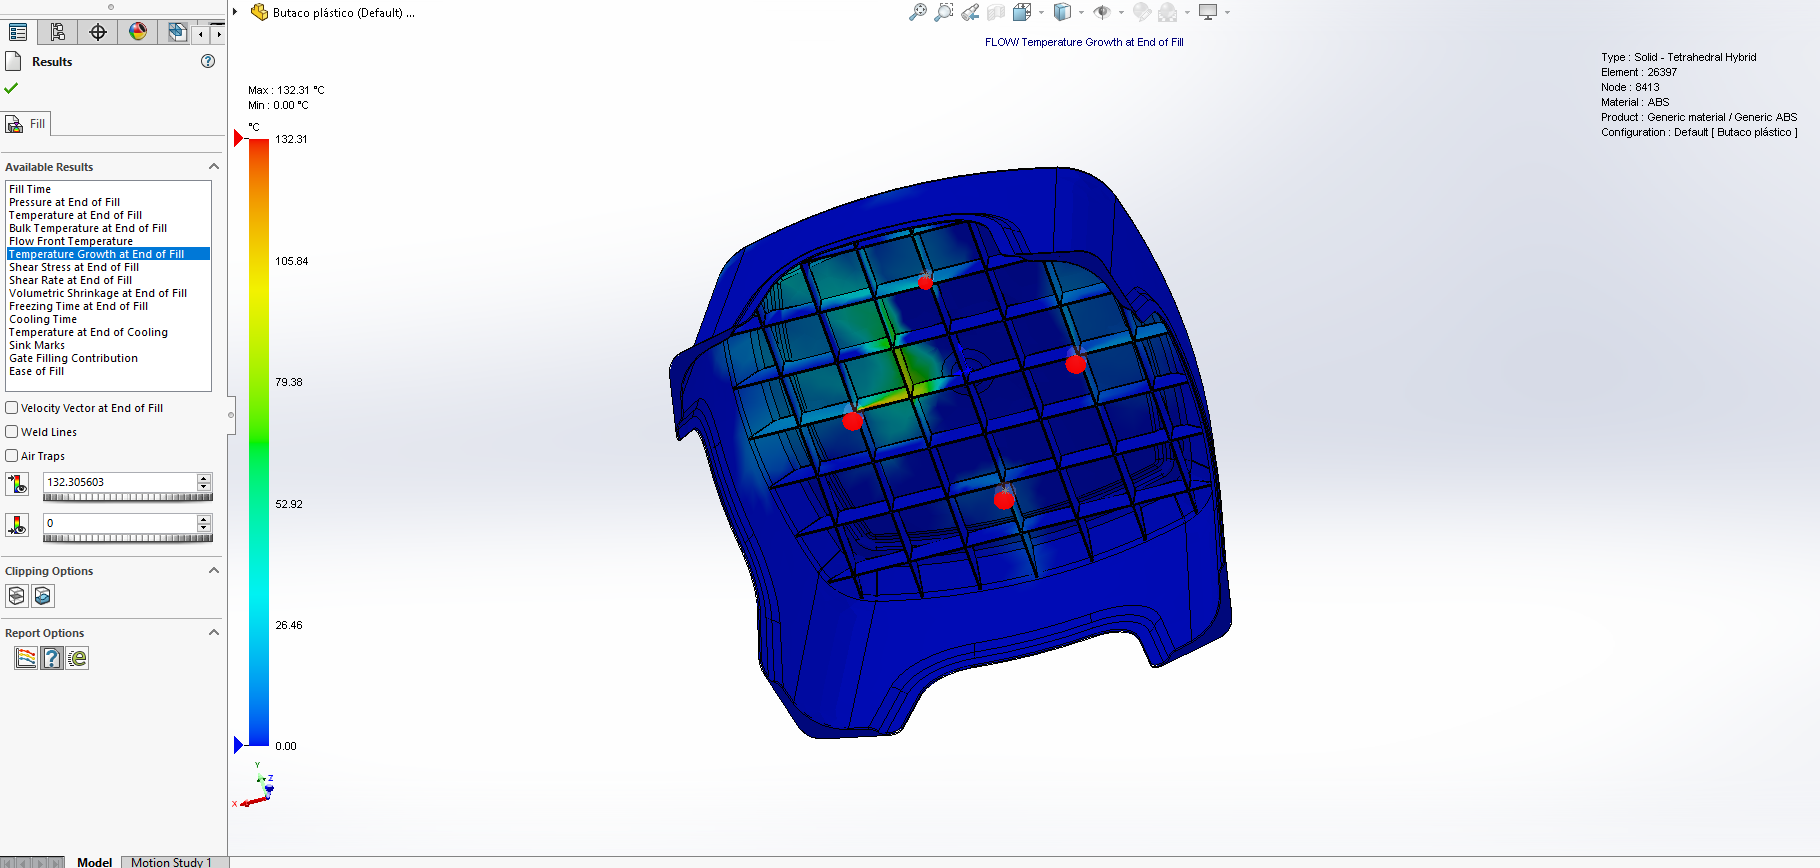
The polymer melt undergoes shear heating during the fill stage in the injection moulding process. This increase in temperature is due to elevated shear rates, which can raise the melt temperature in the cavity to above the set melt temperature. The temperature increase can result from too short filling time, the use of small injection locations, or material flow characteristics. Degradation of the material can occur under extreme conditions.
Shear Stress at End of Fill
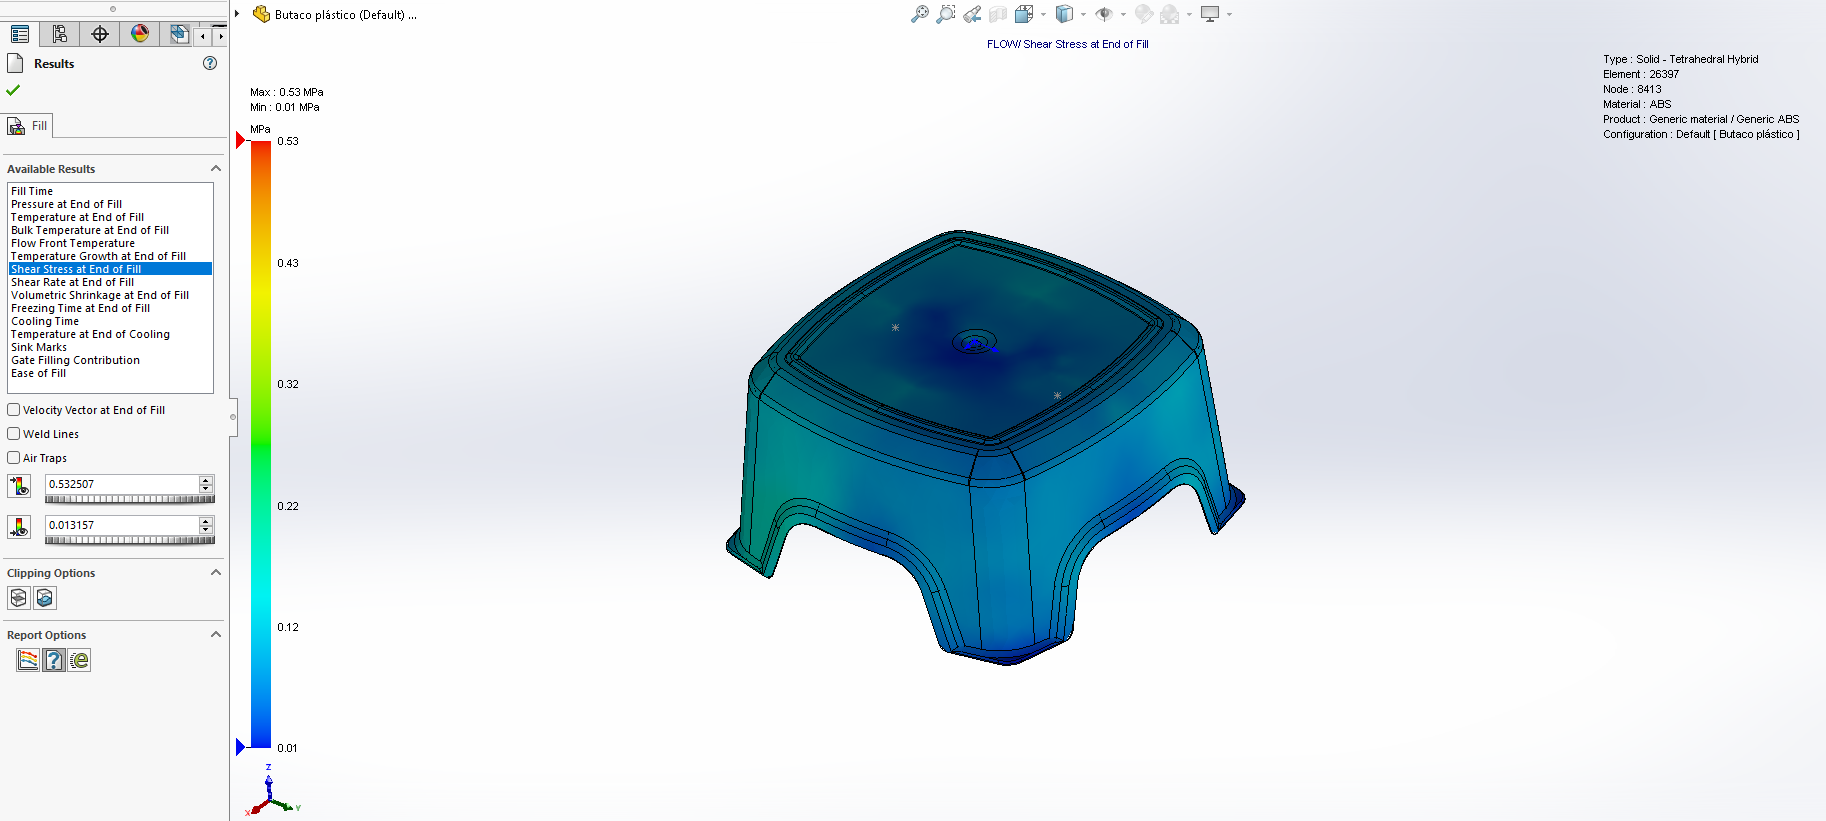
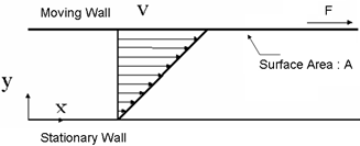
Shear stress is a measure of shear force per unit area. The direction of the shear force is parallel to the plane of the force (the cavity wall) and can be thought of as the force melt used to push the cavity wall in the direction of flow (not pushing outward normal to the wall).
t = F/A
t = Shear stress
F = Applied force
A = Cross-sectional area of the material that is parallel to the applied force vector
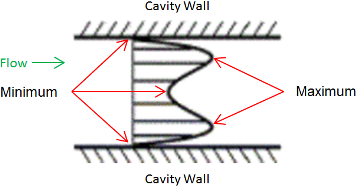
Shear Rate at End of Fill
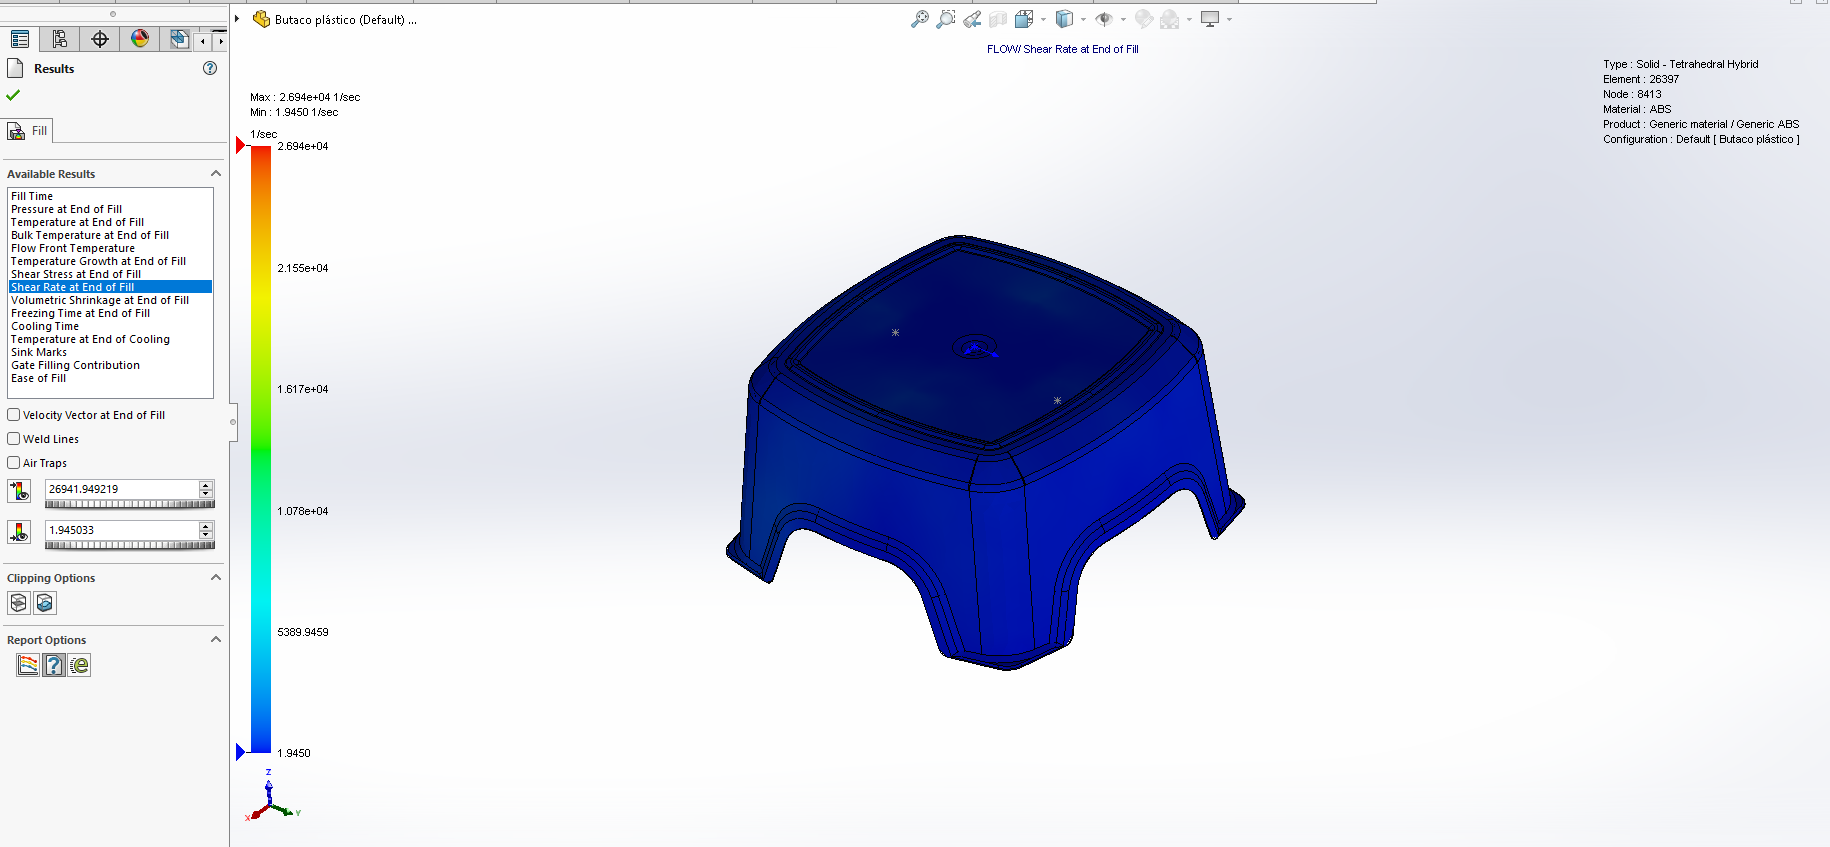
The shear rate measures the velocity of a fluid layer passing over another layer of fluid at a different velocity. The frozen plastic material in contact with the cavity wall does not move relative to the wall, resulting in a zero shear rate (0.0 1/sec). The molten plastic material inside the frozen layer moves over the frozen material, which yields a positive shear rate (>0.0 1/sec). The shear rate increases until a maximum are reached just inside the wall. Then the shear rate begins to decrease toward the flow centre, running a local minimum in the centre. This minimum occurs because the polymer chains at the centre of the flow move at the same speed and do not move relative to each other, resulting in a zero (0.0 1/sec) shear rate.
Volumetric Shrinkage at End of Fill
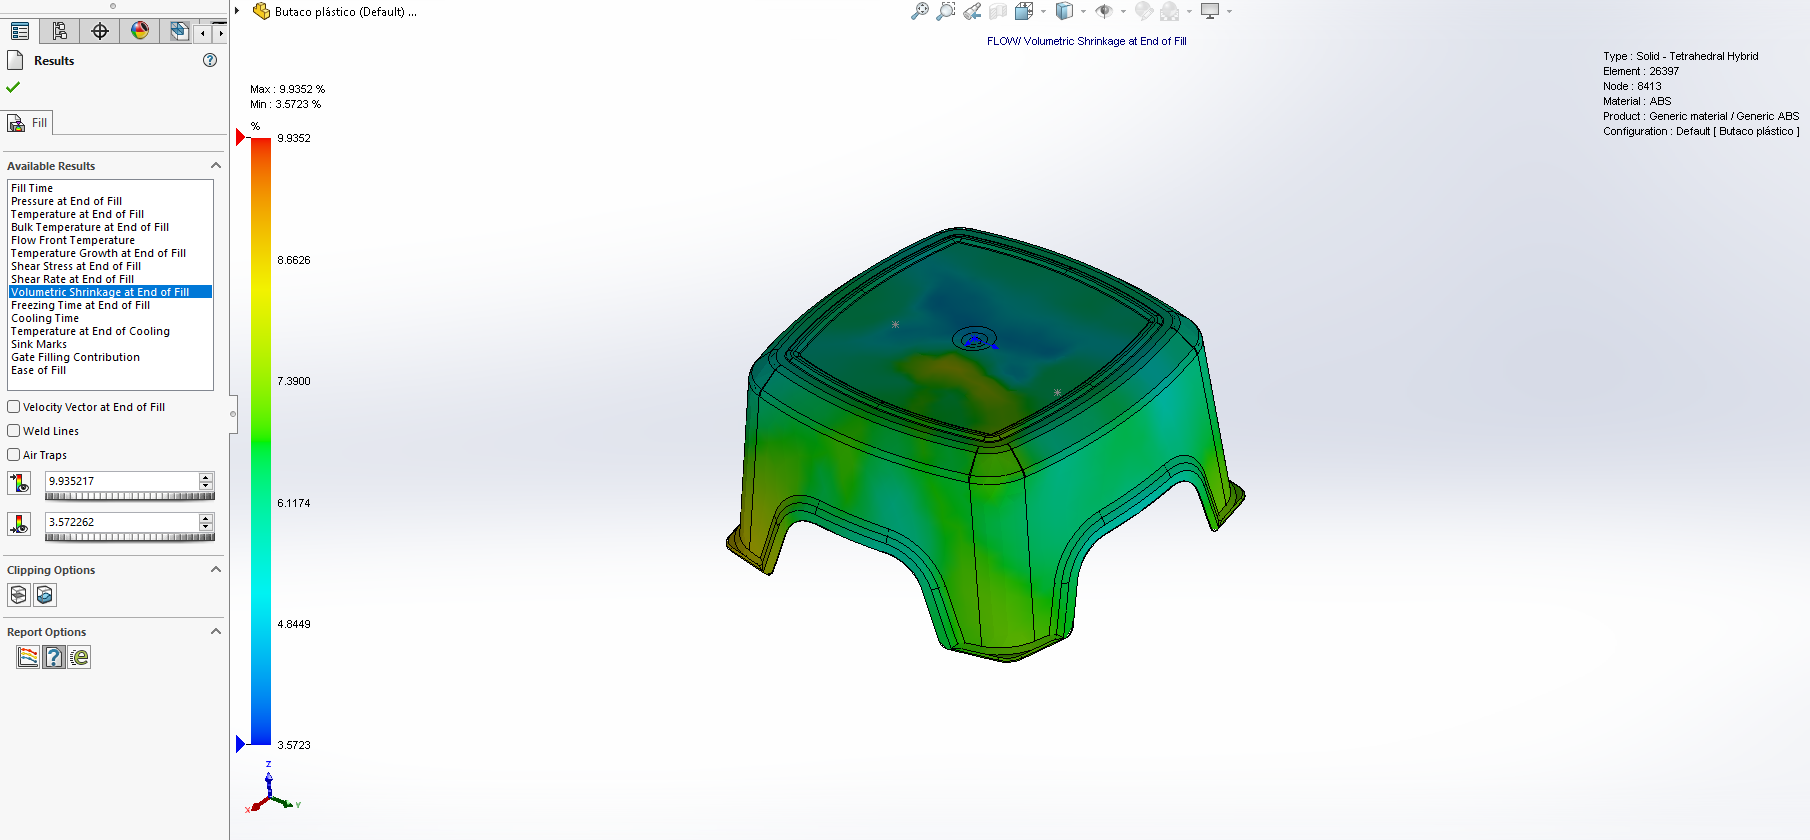
The volumetric shrinkage at the end of fill can indicate areas of potential concern. High shrinkage rates will occur in thick sections of a plastic part that do not undergo a sufficient packing stage during the molding process. For example, if you do not include an adequate packing stage, high amounts of shrinkage will occur at the locations indicated in yellow and red by the volumetric shrinkage at the end of the fill plot.
Another form of shrinkage occurs in the formation of voids. Sometimes, bubbles can be seen inside the part wall in a transparent molded part. These bubbles are not air bubbles; they are vacuum voids. A void occurs when the part surface is rigid enough to retain its shape, and the molten core material tears itself apart from the inside, creating a vacuum void. Voids also occur in opaque plastic parts, but they cannot be seen outside. The molded part must be cut open to see if voids are happening. Typically, voids occur in thicker sections and in areas of changing wall thicknesses (around the connecting rim of a boss or along with the transition from a part wall to a rib).
Freezing Time at End of Fill
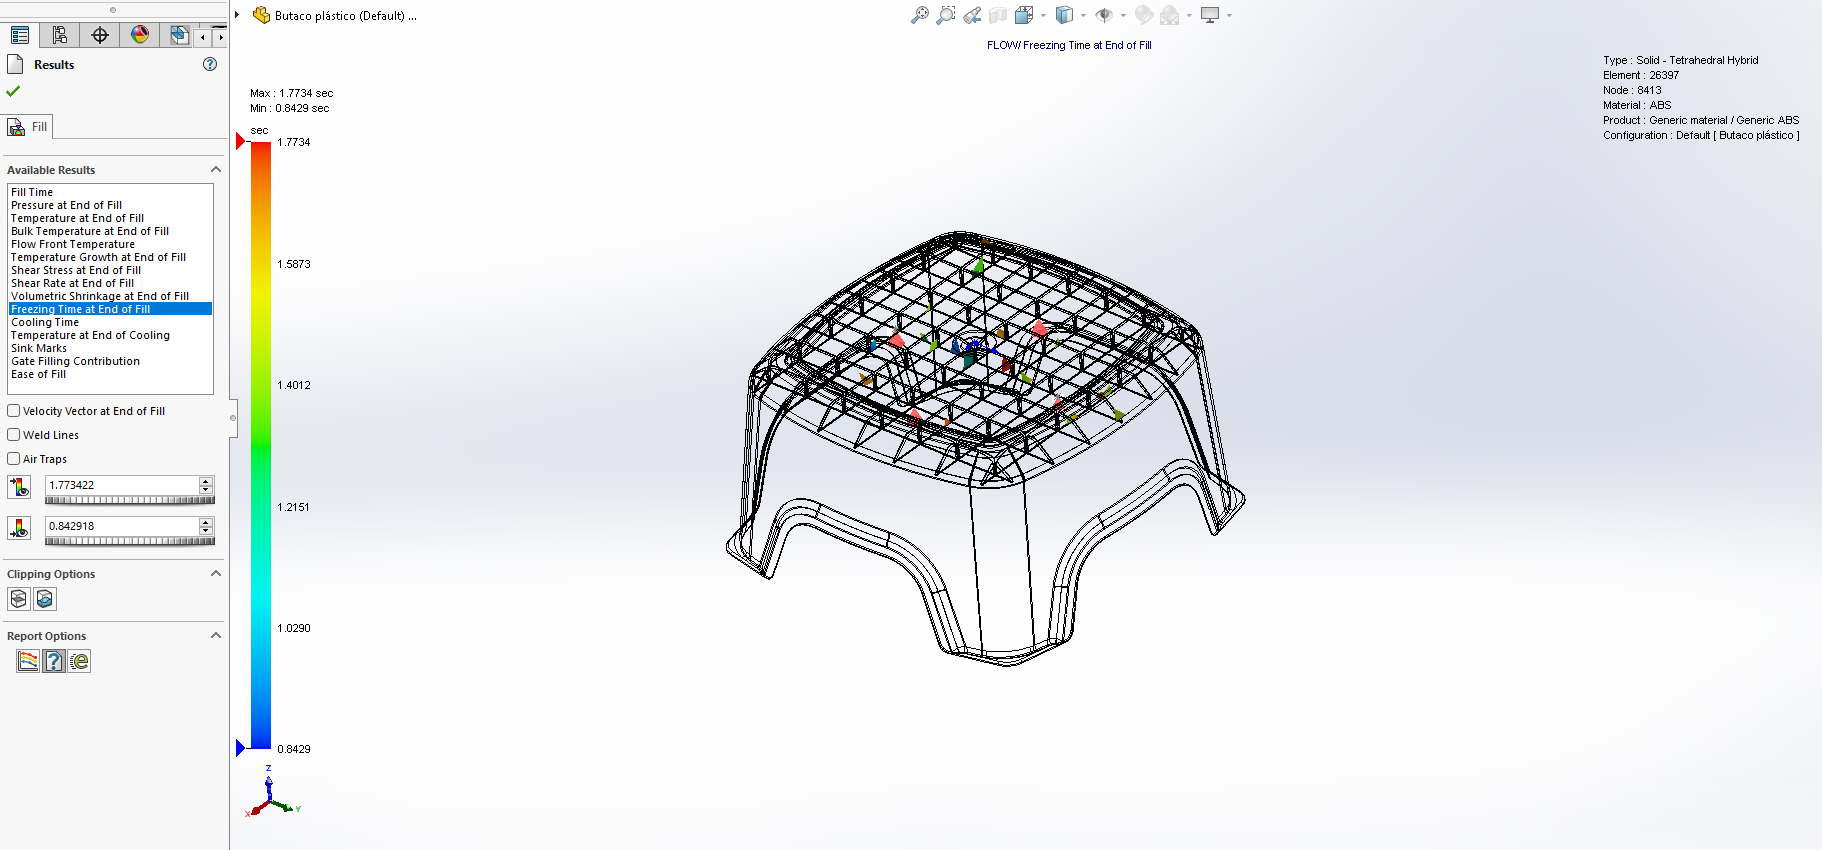
The scale used for the freezing time at the end of fill indicates the time required for the molten plastic material to cool down to its glass transition temperature. The required time depends on the temperature differential between the melt temperature and the mold temperature and the thermal conductivity of the melt and mold. The time needed to reduce a molten melt material to its glass transition temperature is not required to cool the part to its ejection temperature. The material deflection temperature under flexural load is the material ejection temperature. A plastic material deflection temperature under flexural load is roughly 2/3 the material glass transition (Tg) or melt temperature (Tm) in degrees Kelvin.
Cooling Time
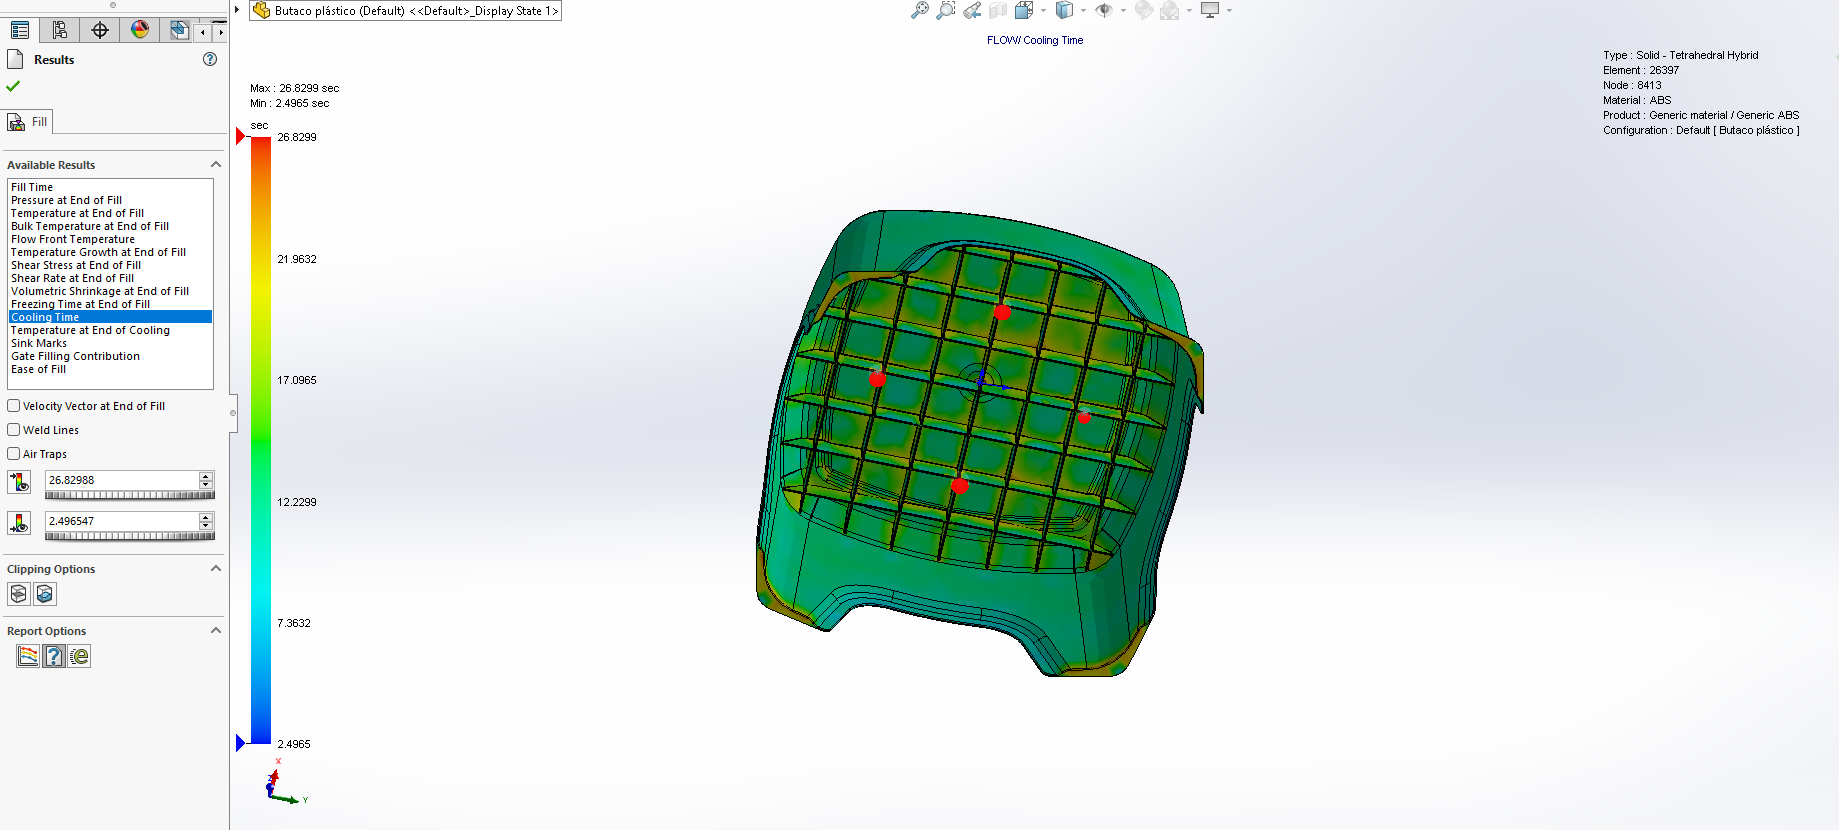
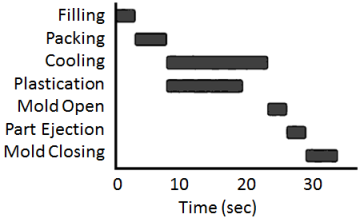
The cooling stage is committed to reducing the material temperature to the deflection temperature under flexural load, the ejection temperature. Typically, cooling time is 70% of the total cycle time.
Two factors that affect cooling time are melt temperature and mold temperature. Increasing either temperature typically results in increased cooling time. Plastics require long cooling times because they are good insulators with low thermal conductivities. Cooling time is proportional to the square of the part wall thickness; doubling the thickness quadruples the cooling time. To reduce cooling times, you should make the part wall thickness uniform and as thin as safely possible.
Temperature at End of Cooling
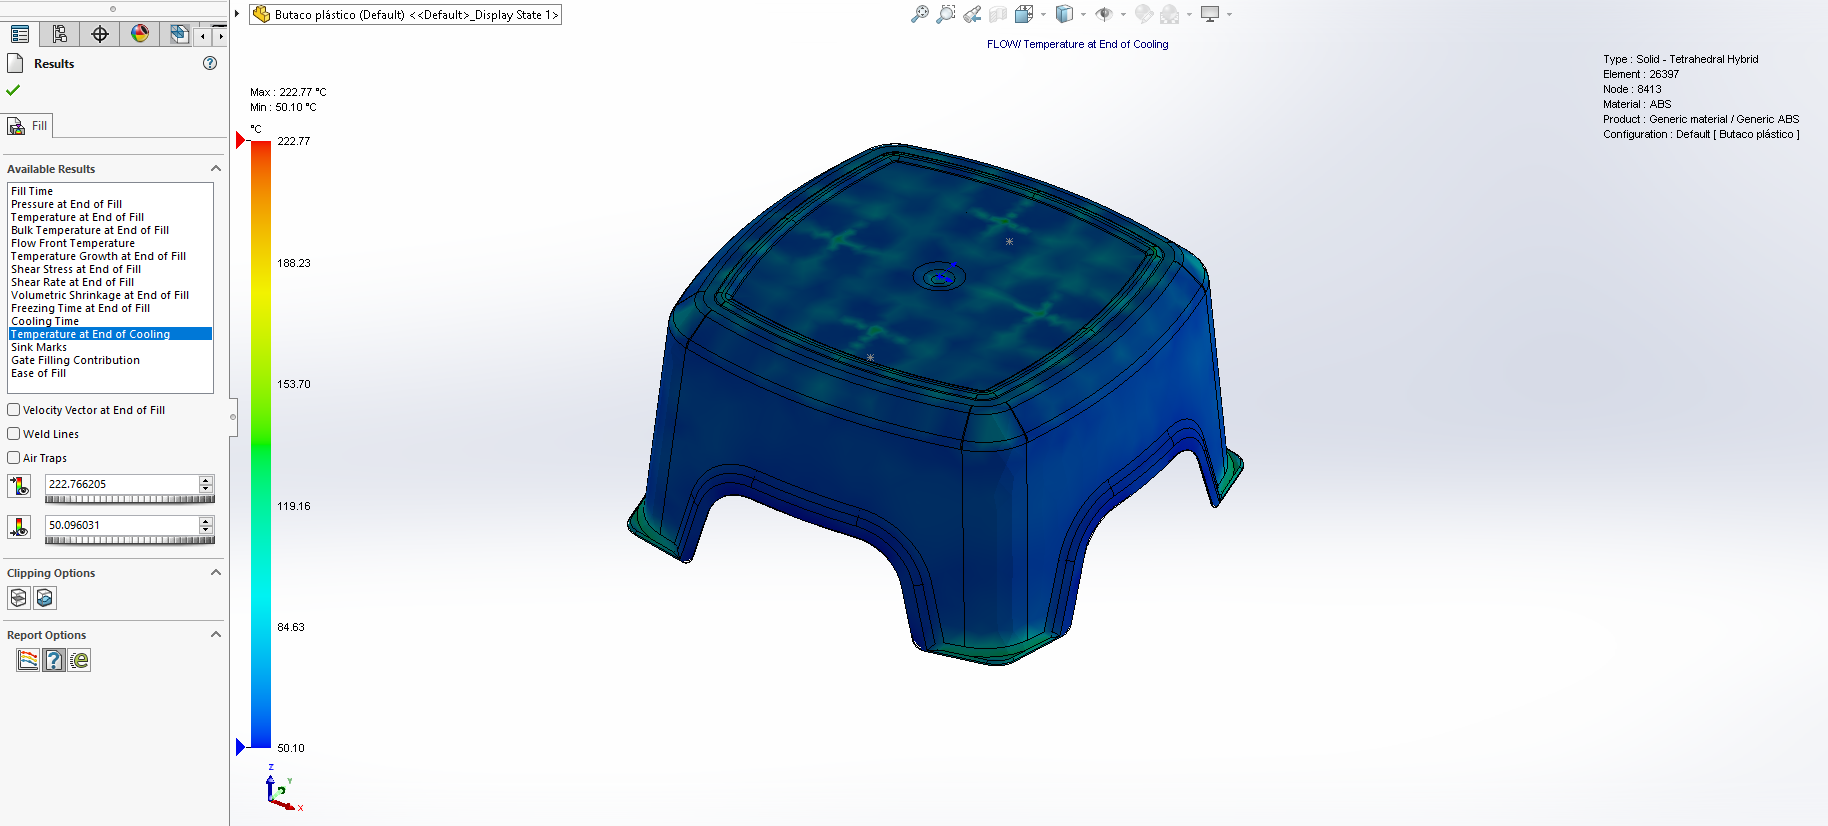
The temperature at the end of the cooling plot is based on when 90% of the part volume is below the material deflection temperature under flexural load, the ejection temperature. If there is a large temperature distribution in thick regions of the part, several problems may occur sink marks, internal voids, or warpage. You should design the part with a uniform wall thickness to reduce these problems.
Sink Marks
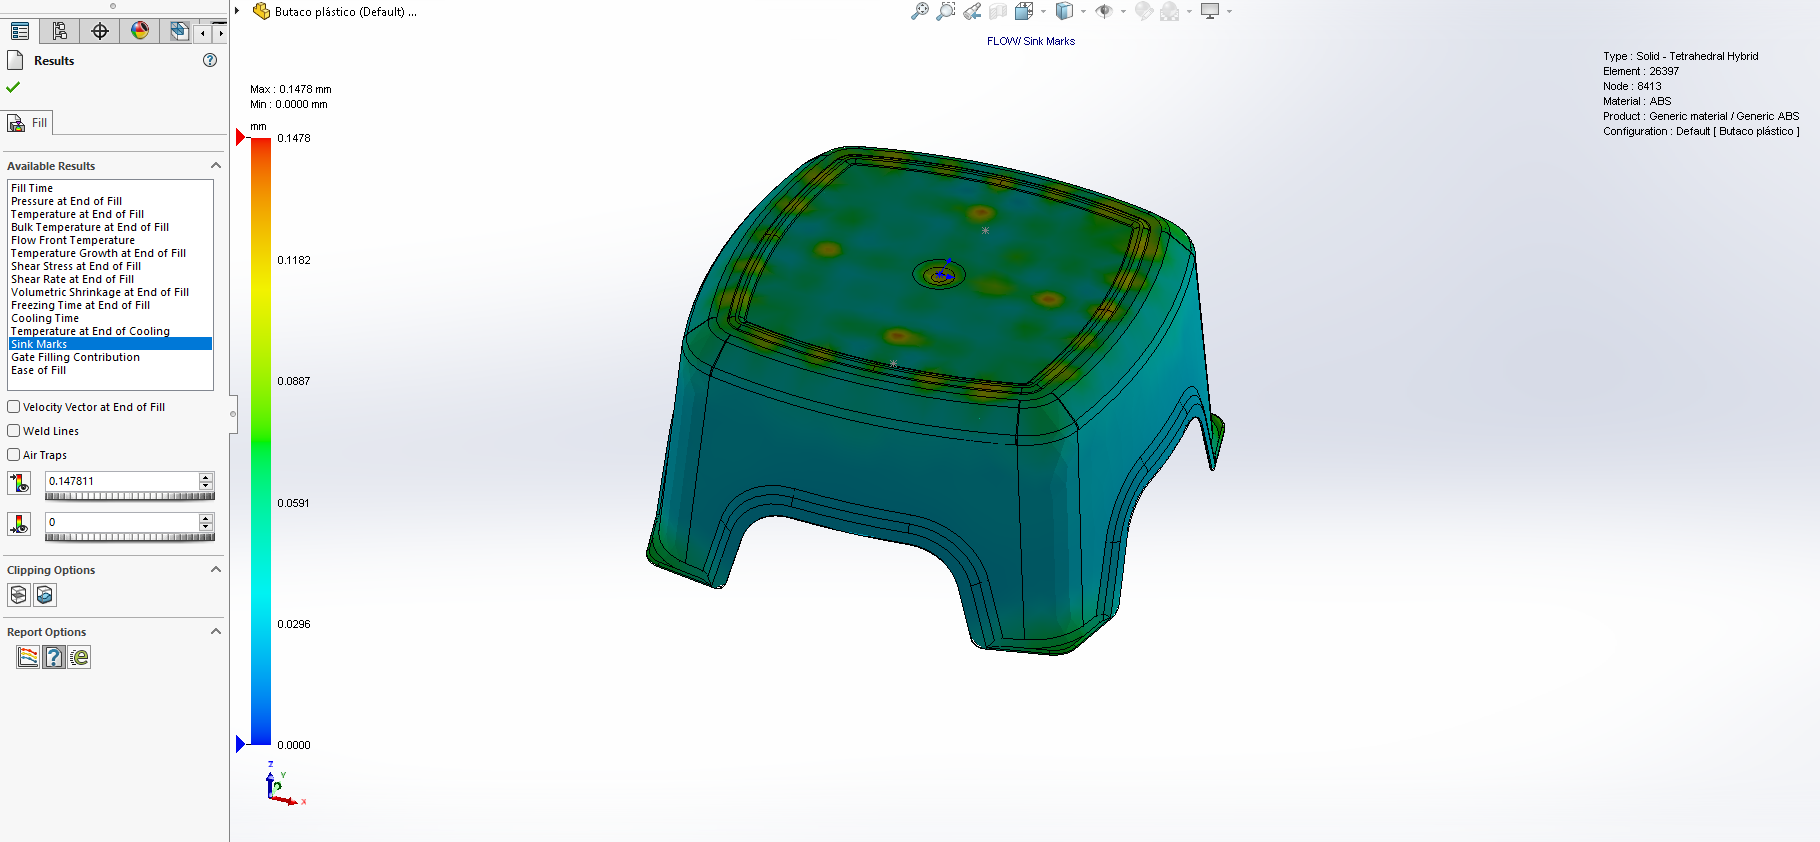
Sink marks are depressions on the surface of an injection-moulded plastic part. The fundamental cause of sink marks is that not enough polymer molecules have been packed into a part to compensate for the shrinkage. Thicker sections of a part cool slower than thinner sections, resulting in significant shrinkage in the thicker branches. After the outer plastic material has cooled and solidified, the molten core material must transfer heat through the solidified plastic surface to the cavity wall. Plastic materials are insulators and do not transfer heat efficiently, which slows down the cooling rate of the thicker core volumes. The more time a plastic material has to cool, the more the material will shrink. The high degree of shrinkage in the core volume pulls the part’s surface inward, causing depression on the part surface.
You can use these design rules to minimize sink marks:
- When safely possible, design with uniform part wall thickness.
- Place injection locations at thicker sections of the part so that the thicker sections can be packed at higher pressures.
- Avoid using injection locations that are too small, preventing sufficient packing of the part cavity.
- Ribs and bosses should be approximately 60 to 80 per cent of the nominal wall thickness.
Injection Location Filling Contribution
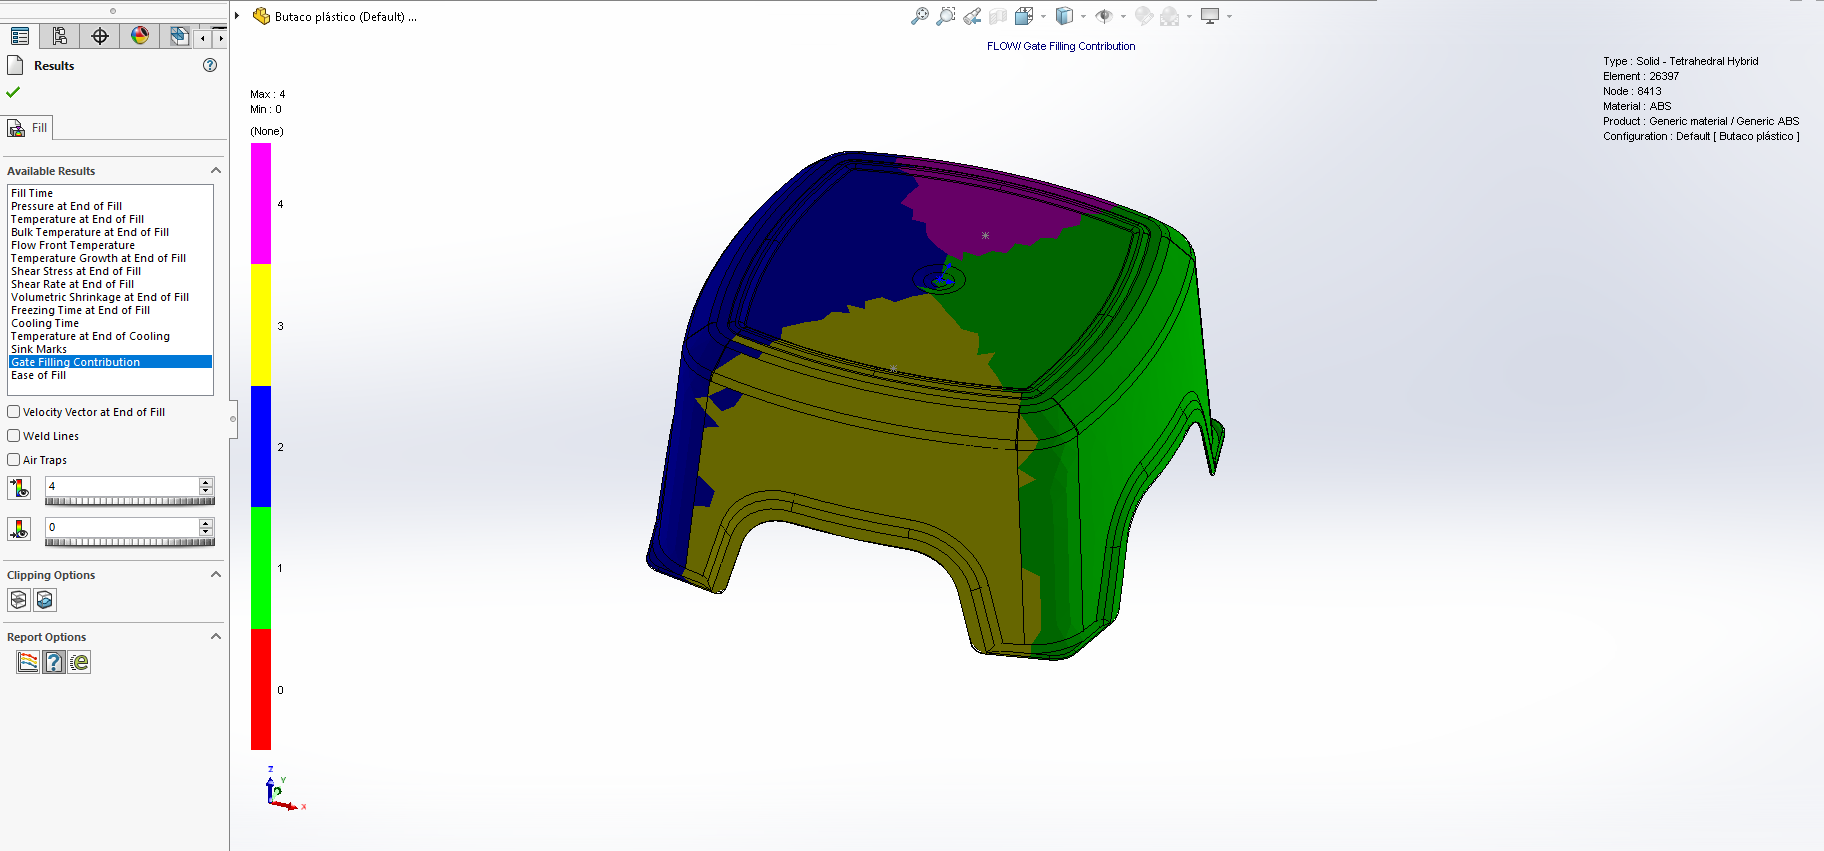
When you only use one injection location, the cavity is filled by that one injection location. When you use multiple injection locations, the cavity is partially filled with material entering from each injection location.
As a result of using multiple injection locations, there will be a significant weld line located where the flow fronts merge. The weld line is at the interface of the green and blue regions.
Ease of Fill
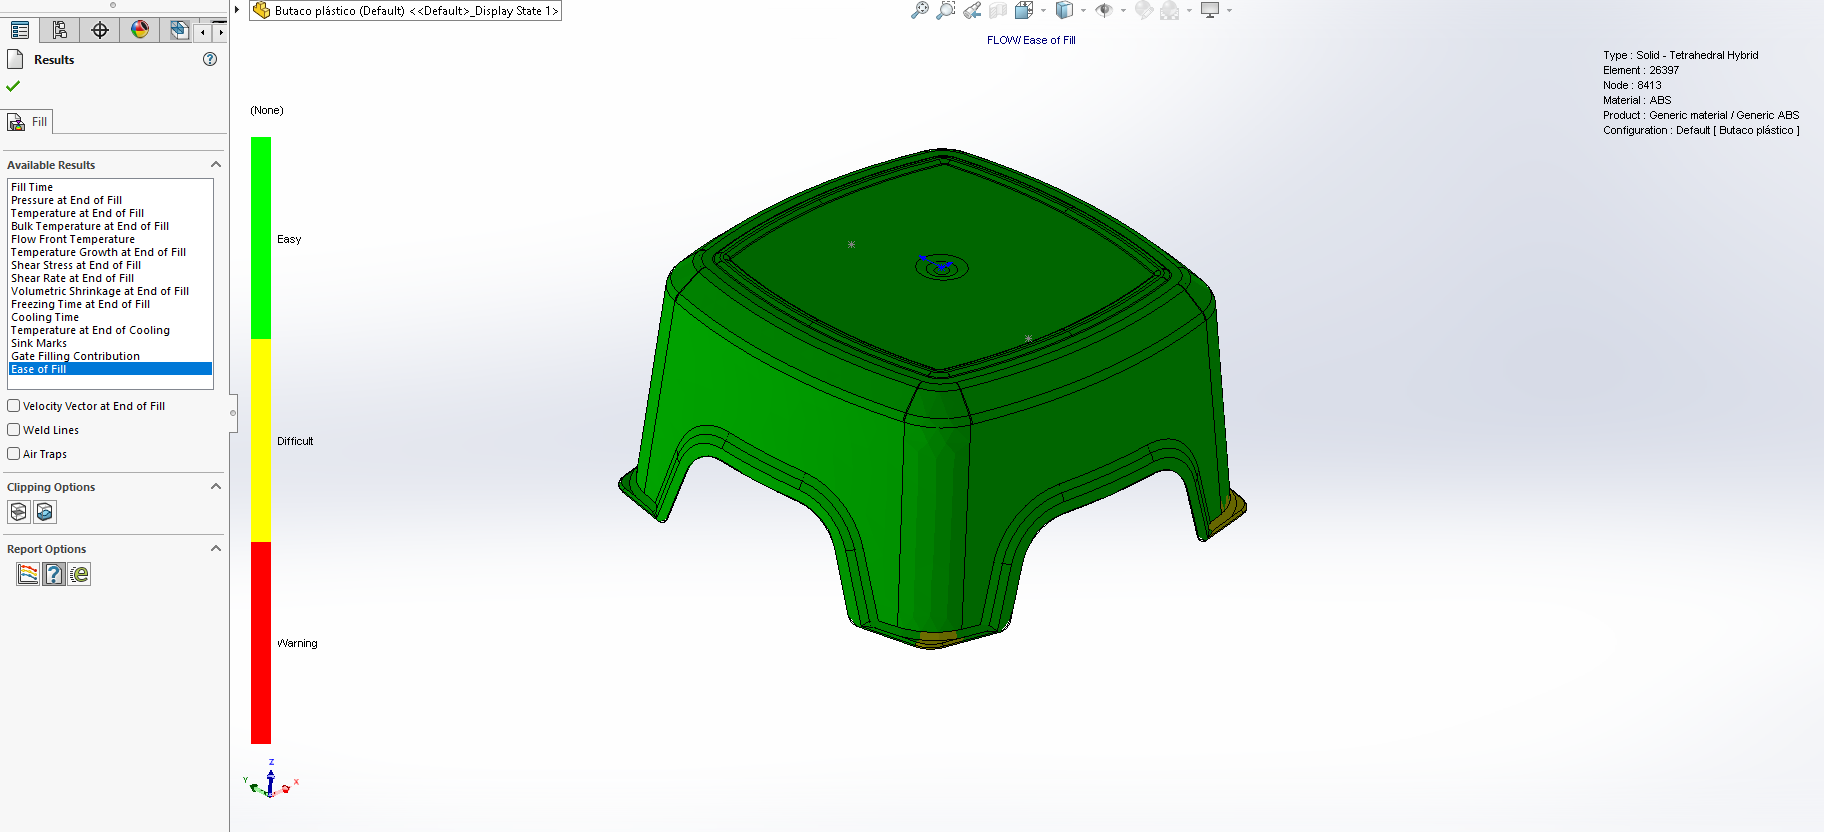
You can use the ease of fill plot to determine whether the cavity fills successfully. The green regions indicate areas that can be filled under normal injection pressures. The yellow regions indicate areas where the injection pressure exceeds 70 percent of the machine’s maximum injection pressure. The red regions indicate areas where the injection pressure exceeds 85 per cent of the machine maximum injection pressure.
Simulate a part cavity only (with no runners), and the ease of fill plot has yellow or red areas. It would help if you tried increasing wall thickness, moving the injection location, adding additional injection locations, changing the material, or adjusting the processing parameters to decrease the pressure required to fill.
If you like us to analyse your plastic parts before production or to analyse production issues, don’t hesitate to contact us.